Let me start by saying I am not a Gann expert. I read an article about the accuracy of his predictions and my curious nature prompted me to add the Square of 9 (comes with Sierra Chart) to my charts.
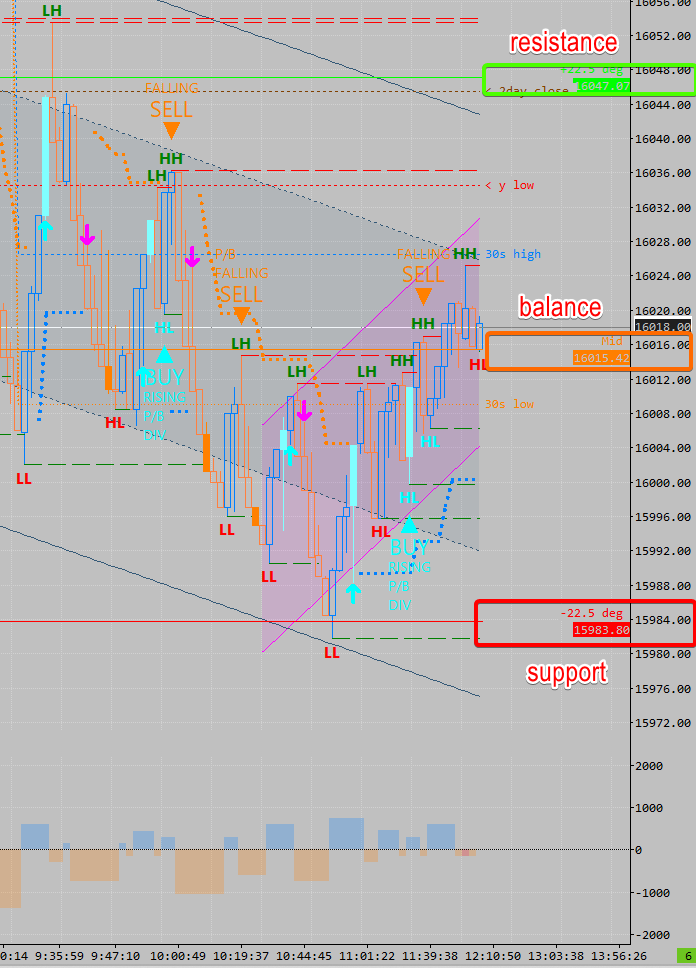
I am amazed at how price behaves at these levels. I do not trade them per se, but I do use them as guides. For example, if I get a sell signal but price is at the -22.5 degree level, I will be cautious about entering. Price does pause at the levels so for me, those levels are LOI’s.
Here is a summary of how to use W.D. Gann’s Square of 9 for identifying support and resistance levels in financial markets:
The Square of 9 is essentially a 9×9 grid of numbers from 1 to 81. The center number is 45. You create the grid by simply squaring each number from 1 to 9 and placing it in order.
Key aspects in using the Square of 9:
- Identify important swing highs or lows in the market, and note the price levels.
- Locate that price on the Square of 9. The closest number on the grid to the actual price is used.
- Horizontal and vertical lines through that number provide levels of support and resistance. Numbers on the same horizontal or vertical line are harmonically related.
- Numbers on the diagonals also indicate harmonic relationships.
- Time can also be mapped onto the Square of 9 in a similar harmonic manner when forecasting turning points.
The idea is that markets have numerical harmonic vibrations, resonating around the Square of 9. Key levels indicated on the Square are likely to provide support and resistance during market moves. It is used to forecast likely turning points by identifying price and time targets.
If you are interested in learning more about Gann’s Square of Nine – there are quite a few resources on the world wide web!
Leave a Reply